What’s the best way to gather data that doesn’t leave you second-guessing?
If you’re dealing with research, you know how important it is to get solid, reliable data.
That’s where quantitative observation steps in.
In this article, we’ll look into everything you need to know about quantitative observation.
We’ll cover what it is, how it’s different from qualitative observation, and why it’s so widely used across various fields like education, healthcare, and marketing.
By the end, you’ll see why this method is a go-to for researchers who need precise, measurable results:
What is quantitative observation?

Quantitative observation is a research method that involves collecting and analyzing numerical data about people, objects, or events. It’s often used to measure specific variables, such as frequency, duration, or intensity. Quantitative observation can be conducted in various settings, including laboratories, classrooms, and public places.
Quantitative and qualitative observation – what’s the difference?
When it comes to research, you’ll often hear about two main types of observations: quantitative and qualitative.
Both have their place, but they’re pretty different in what they focus on and how they’re used.
Let’s break it down.
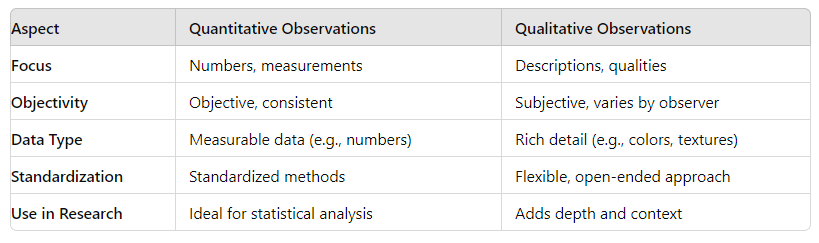
Focus on numbers vs. descriptions
Quantitative observations are all about numbers. If you can count it, measure it, or express it in figures, it falls into the quantitative camp.
Think of things like:
- the temperature of a room,
- the number of people in a line,
- or the speed of a car.
This type of observation gives you hard data that you can analyze and compare.
On the other hand, qualitative observations focus on descriptions. They’re about the qualities of what you’re observing.
For example, instead of saying, “The car is going 60 mph,” you’d say, “The car is moving quickly.” It’s more about what something is like than how much there is of it.
Objectivity vs. subjectivity
Quantitative observations are usually more objective. The data you gather isn’t influenced by opinions or feelings – it’s just numbers. This makes it reliable when you’re looking for facts that can be backed up by statistical analysis.
Qualitative observations, however, are more subjective.
They depend on the observer’s perspective and interpretation. Two people might describe the same event differently, which can make this type of observation more varied and rich, but also less consistent.
Measurable data vs. rich detail
When you gather quantitative data, you’re looking for specific measurements.
This might include things like:
- height,
- weight,
- or quantity.
It’s precise and can be used in graphs, charts, and statistical models.
Qualitative data, though, is more about the details that don’t fit into neat little boxes.
It includes things like colors, textures, feelings, and experiences. This data is harder to measure, but it adds depth and context to your research.
Standardization vs. flexibility
Quantitative observation methods are usually standardized. You use the same tools and processes each time to make sure your data is consistent. This is great for making comparisons across different studies or groups.
Qualitative observation, in contrast, is more flexible. It allows you to explore your subject in a more open-ended way, which can lead to new insights and understanding that you might miss with a more rigid approach.
So, whether you’re counting heads or describing feelings, both quantitative and qualitative observations play important roles in research. Each brings something valuable to the table, helping you see the full picture.
Comparison table
You may also like:
The benefits of quantitative observations
Quantitative observation has attractive advantages, and the most important ones are:
It provides objective and reliable data that can be analyzed statistically
When you’re collecting quantitative observation data, you’re gathering facts that are clear-cut and free from personal bias.
This makes the data objective and reliable, which is a big deal in scientific research.
With these numbers in hand, you can engage in statistical analysis, where patterns and relationships start to emerge.
The beauty of this approach is that it strips away guesswork, leaving you with solid evidence that can back up your findings.
Unlike qualitative observation, which leans on descriptions, quantitative observations give you something concrete to work with.
It allows for precise measurement and comparison of variables
When it comes to measuring and comparing variables, quantitative research is the tool of choice.
Quantitative observation methods focus on capturing exact values – whether it’s the height of a plant, the number of customers, or the temperature of a liquid.
This precision is key in the research process because it lets you compare different factors head-to-head.
With standardized observation techniques, the data you gather is consistent and reliable across the board.
It doesn’t matter if you’re working on a big project or just trying to understand a small detail, quantitative observations help you keep everything measured and comparable.
It can be used to test hypotheses and identify patterns and trends
In scientific research, testing hypotheses is a key part of the job.
Quantitative observation research plays a huge role here.
Thanks to gathering quantitative data through systematic observation, you can put your ideas to the test.
The numbers you collect can either support your hypothesis or show you where things aren’t adding up.
Plus, as you gather more data, you start to see patterns and trends that weren’t obvious at first.
This is where quantitative and qualitative observation work hand in hand.
The hard numbers from quantitative research point you in the right direction, while qualitative observations add the context you need to understand the bigger picture.
You may also like:
Where is quantitative observation applied? Top use cases
Quantitative observation can be used in a variety of fields, including:
Marketing: measuring customer behavior and preferences
Imagine a store tracking how many customers stop to look at a new product display or how long they spend browsing a particular aisle.
These numbers tell a story about what catches people’s attention and what doesn’t.
For instance, a study published in the International Journal of Advertising explored the effectiveness of retail window displays as part of the marketing mix.
The researchers worked with Boots the Chemists and Nottingham Business School to measure how window display design influences consumer-buying behavior.
They found that connecting buying behavior to specific marketing elements, like window displays, made sales forecasting more predictable.
If a lot of people are lingering by a new clothing line but not buying, it might suggest they’re interested but need a nudge, maybe a sale, or better positioning.
This kind of data helps businesses tweak their strategies to match customer behavior.

Education: assessing student engagement and learning outcomes
In education, teachers often use quantitative observation to see how students are engaging with their lessons.
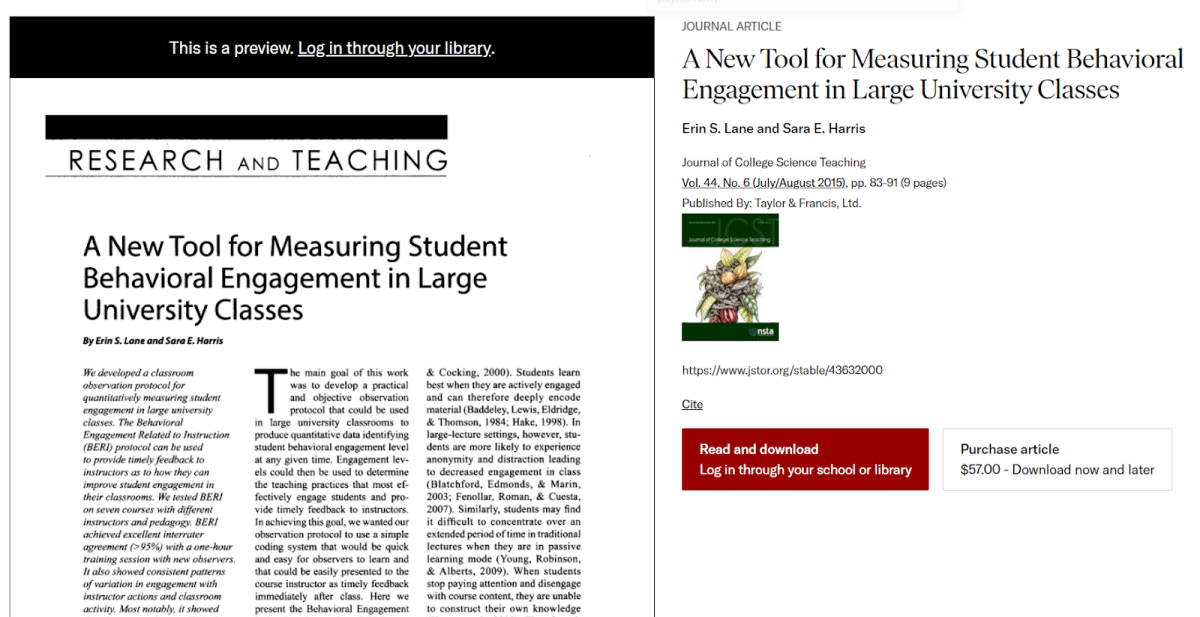
For example, a study presented in the Journal of Educational Psychology introduced the Behavioral Engagement Related to Instruction (BERI) protocol.
This protocol was specifically designed for large university classrooms to measure student engagement levels through quantitative observation data.
The BERI protocol involves tracking student behaviors in real-time, offering teachers immediate feedback on how well students are engaging with the material.
For instance, if students are actively participating in discussions or focusing on tasks during lectures, the data collected can show high levels of engagement.
On the other hand, if students appear distracted or disengaged, the data can highlight areas where the teaching method might need adjustment.
These numbers help educators identify which teaching strategies are working and which might need a different approach. If the protocol shows that students are more engaged during interactive lessons compared to traditional lectures, it indicates a need to incorporate more interactive elements into the curriculum.
This kind of targeted feedback helps instructors refine their methods to improve student learning outcomes.
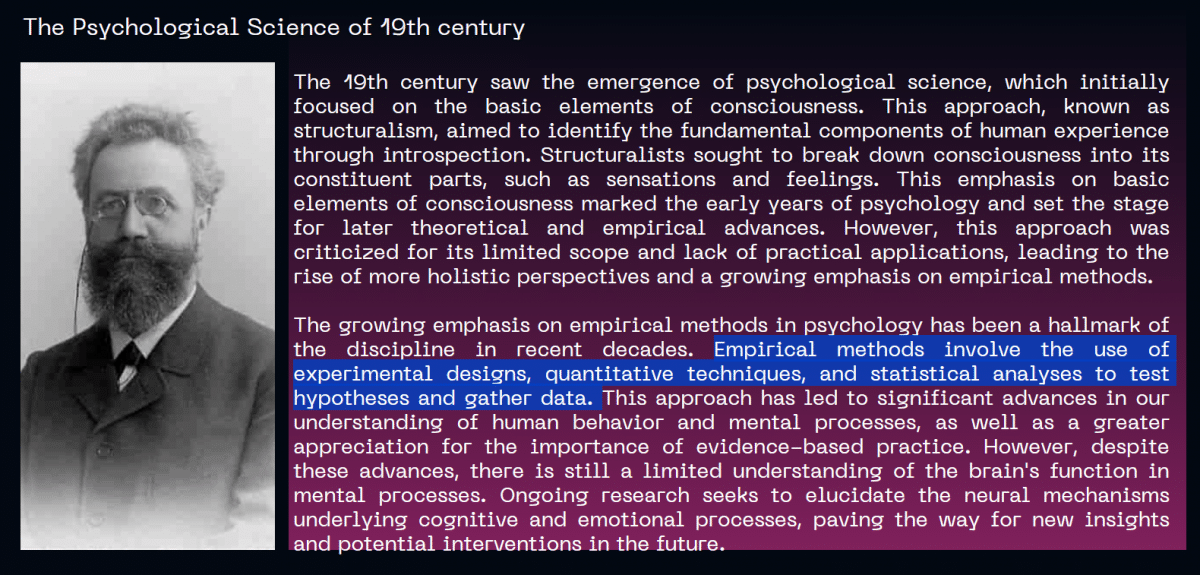
Psychology: studying human behavior and cognition
Psychologists use quantitative observation to dig into the details of human behavior.
For example, a well-known study in the field of memory research conducted by Ebbinghaus in the late 19th century focused on how quickly people forget information.
In this study, participants were asked to memorize lists of nonsense syllables, and then their recall was tested at different time intervals.
The researchers measured how many syllables participants could remember after varying lengths of time, such as immediately after learning, after a few hours, and after several days.
The numbers collected from these tests helped to map out the “forgetting curve,” which shows that memory retention decreases sharply soon after learning but then levels off over time.
This type of quantitative data is often used in psychology, as it helps researchers understand how memory works and how factors like stress or fatigue might impact recall.
Sociology: investigating social phenomena and trends
In sociology, quantitative observation helps researchers understand broader social trends.
A notable study published in the American Political Science Review examined voting behavior across various neighborhoods in a large metropolitan area.
The researchers collected quantitative data on voter turnout by tracking the number of people who participated in elections in different districts over several election cycles.
The study revealed that neighborhoods with lower voter turnout often had higher levels of economic disadvantage, lower educational attainment, and less access to transportation.
These patterns were not immediately obvious without the data. By analyzing the numbers, sociologists were able to identify the social factors that contributed to lower voting rates.
This type of research helps sociologists understand the underlying reasons for such trends and suggests potential interventions.
For instance, the findings might prompt community programs aimed at increasing voter education or improving access to polling stations.
Quantitative observation in sociology is essential for uncovering these hidden patterns and driving efforts to address social inequalities.
Healthcare: evaluating the effectiveness of medical treatments and interventions
In healthcare, quantitative observation is useful for evaluating the effectiveness of medical treatments.
A well-known example is the clinical trial of the drug Streptomycin in the treatment of tuberculosis, conducted in the late 1940s.
This was one of the first randomized controlled trials (RCTs) in medical history, which set the standard for future clinical research.
In this study, researchers quantitatively observed and recorded the number of patients who showed improvement in their tuberculosis symptoms after taking Streptomycin compared to those who received a placebo.
The results showed a statistically significant improvement in the recovery rates among those treated with the drug, confirming its effectiveness.
This study provided clear evidence of the drug’s efficacy, shaping the future of tuberculosis treatment and demonstrating the power of quantitative observation in healthcare.
Thanks to systematically tracking patient outcomes, healthcare professionals were able to make informed decisions about adopting Streptomycin as a standard treatment.
You may also like:
6 great customer feedback examples
8 close-ended questions examples for better market research
What is semantic differential scale?
SurveyLab for quantitative observation – how does it work?
SurveyLab is a tool that takes quantitative observation to the next level.
If you’re looking to gather precise data and gain deep insights, this platform has you covered.
With SurveyLab, you can create online tests that score automatically and make data collection straightforward.
It doesn’t matter if you’re measuring customer satisfaction, employee engagement, or any other metric, the platform’s scoring mechanism helps you keep everything in check.
- One of the standout features is the ability to set up complex satisfaction indicators and key performance indicators (KPIs). These metrics give you a clear picture of what’s working and what needs attention.
- Plus, with the advanced analytical tools that SurveyLab offers, you can engage in data analysis and discover patterns you might have missed otherwise.
- The platform lets you generate graphical reports that make your findings easy to understand and share. And if you need to dig deeper, you can export the data for further analysis.
But SurveyLab isn’t just about gathering data – it’s about making sense of it.
The combination of scoring, metrics, data collection, and data analysis tools means you can conduct quantitative observations that lead to real, actionable insights.
It’s like having a full toolkit at your disposal, ready to help you make informed decisions based on solid data.
Ready to see how SurveyLab can change your quantitative observation efforts?
Try it today and access the insights that will drive your success.
And for more educational content, check our blog out.